| Figure Number |
Thumbnail |
Caption |
Credit |
| FIGURE 33.1 |  | Fluctuations in climate affect all of Earth's systems, including biomes such as the tropical rainforest. | photos.com |
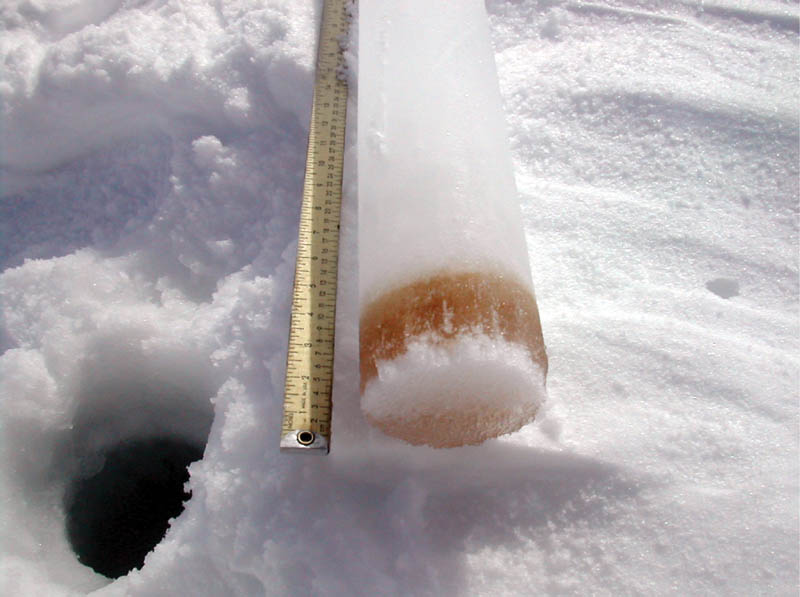
| FIGURE 33.2 |  | Ice core showing algae band. | NOAA |
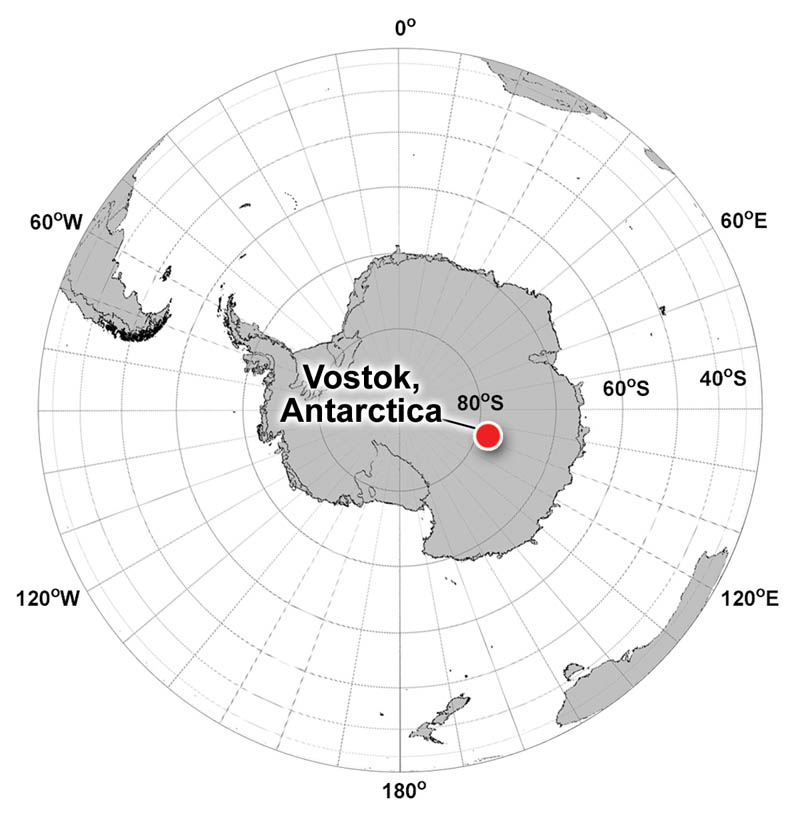
| FIGURE 33.3 |  | Map showing the location of Vostok, Antarctica. | U.S. Satellite Laboratory |
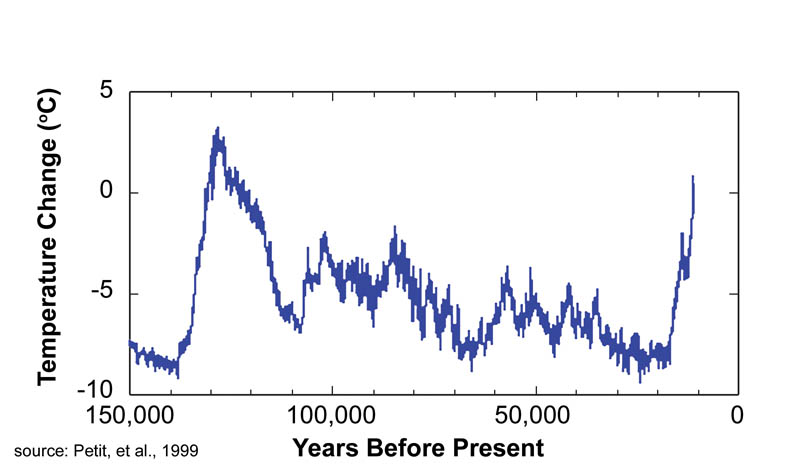
| FIGURE 33.4 |  | Data for the past 150,000 years show fluctuations and temperature differences from a modern baseline of data. Results were derived using measurements of a variation of common oxygen from ice core samples at Vostok Station in Antarctica. | NOAA, National Climate Data Center (NCDC) |
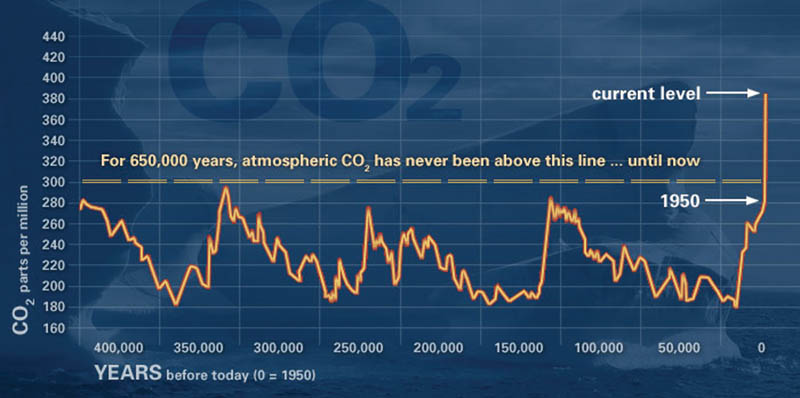
| FIGURE 33.5 |  | This graph, based on the comparison of atmospheric samples contained in ice cores and more recent direct measurements, provides evidence that atmospheric CO2 has increased since the Industrial Revolution. | NASA, NOAA |
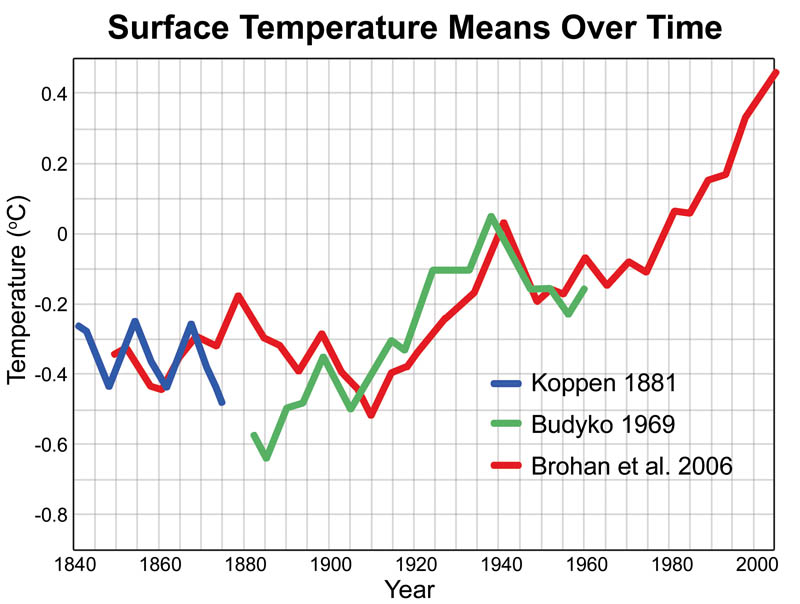
| FIGURE 33.6 |  | Average temperatures derived from land-based, ship, and SST data from around the globe. | Koppen (1881), Budyko (1969)and Brohan et al. (2006) |
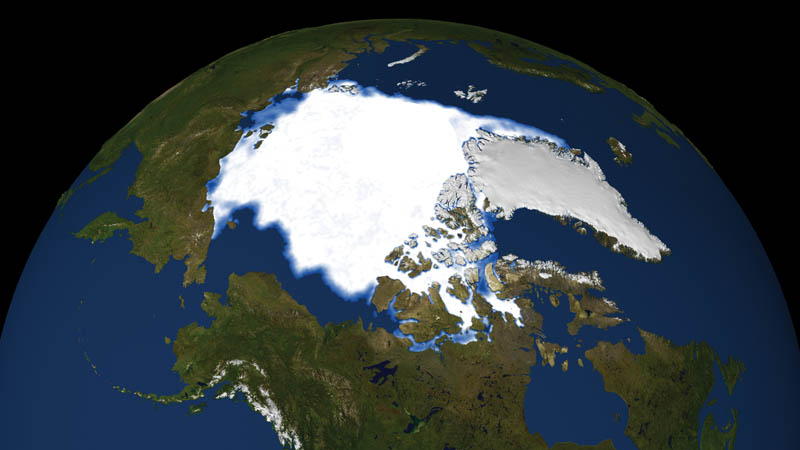
| FIGURE 33.7 |  | Arctic sea ice coverage in September 1979. | NASA |
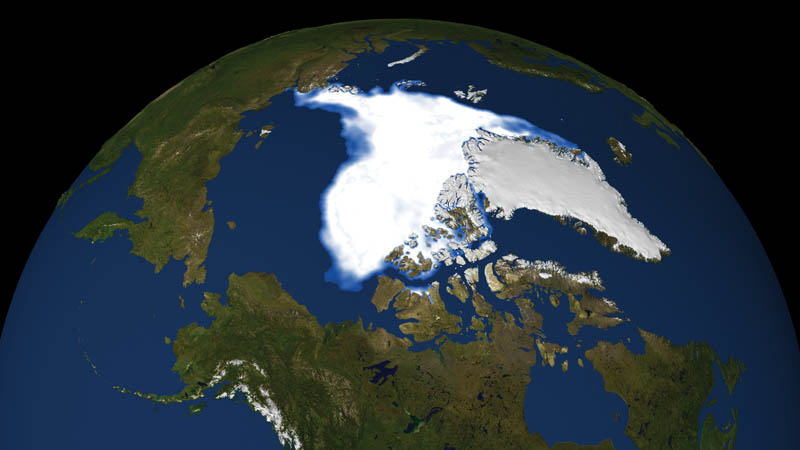
| FIGURE 33.8 |  | Arctic sea ice coverage in September 2007. | NASA |
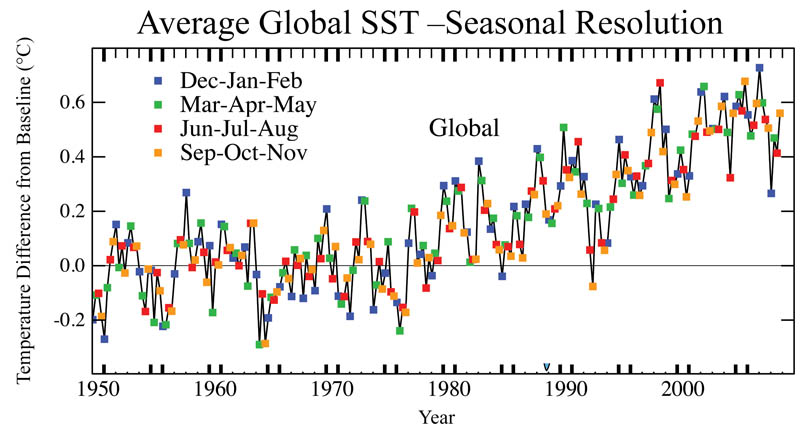
| FIGURE 33.9 |  | Each season's average global SST from 1950 is compared to the average SST for the 1951–1980 base time period. | NASA, Goddard Institute for Space Studies (GISS) |
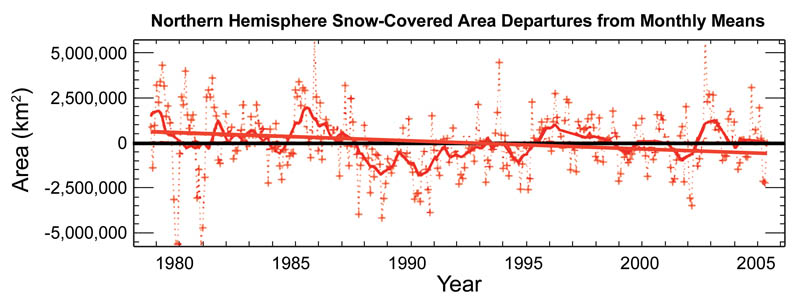
| FIGURE 33.10 |  | Annual Northern Hemisphere snow cover averages' best fit line (solid red) is created from data from NOAA snow charts and satellite data. Each point on the line of best fit, providing an approximation to what is happening, is compared to the average for 1978–2005. | Adapted from National Snow and Ice Data Center |
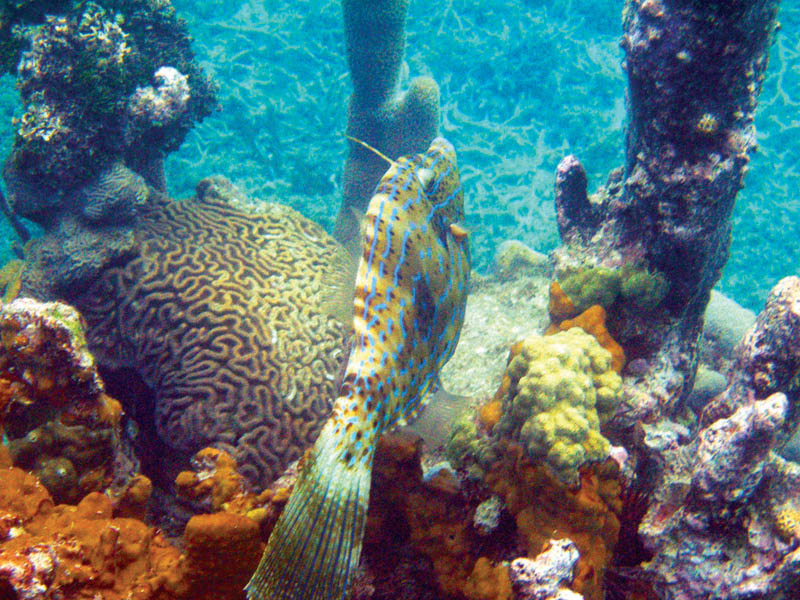
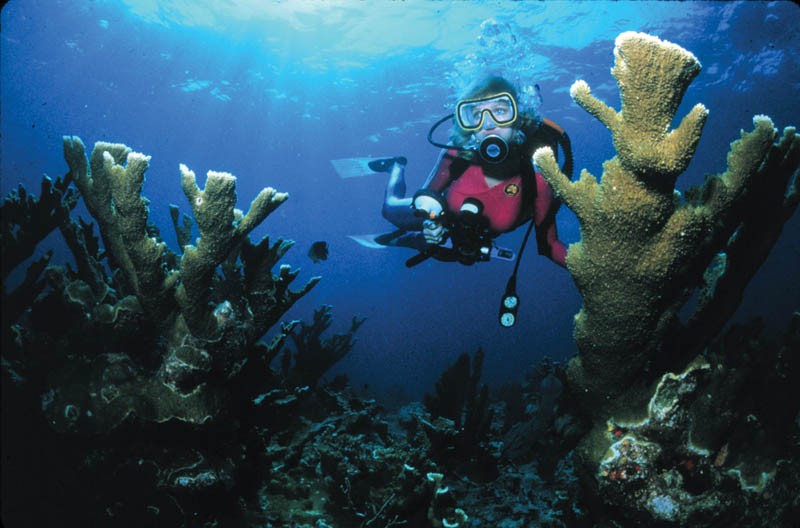
| FIGURE 33.11 |  | This coral reef in Puerto Rico provides a habitat for a wide variety of organisms. Coral reefs are susceptible to changes in temperature, sediment runoff, and other environmental impacts. | NOAA CCMA Biogeography Team |
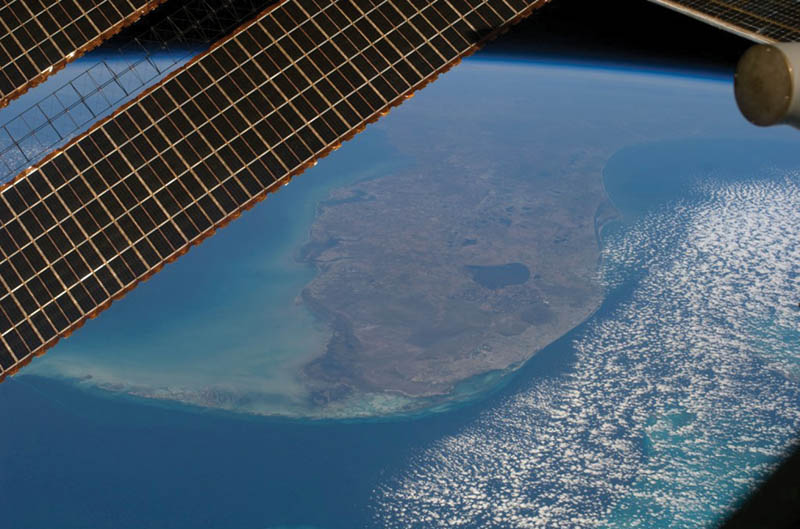
| FIGURE 33.12 |  | Florida's coastal reefs are visible in the Florida Keys in this image photographed from the International Space Station. One of the Station's solar panels is shown in the top left of the photograph. | NASA |
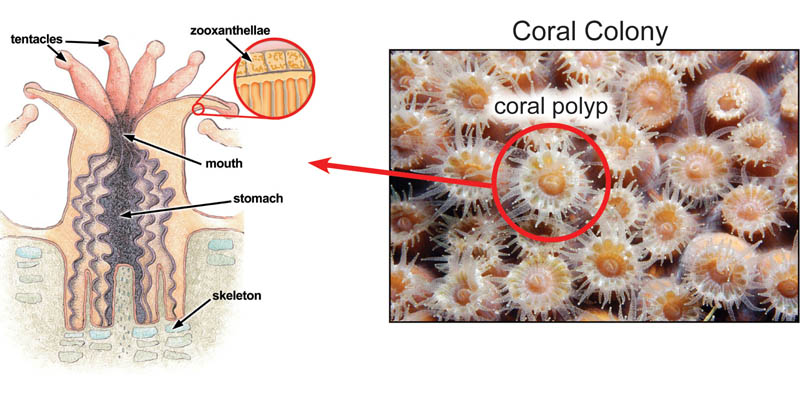
| FIGURE 33.14 |  | Reefs are made of thousands of individual coral polyps. Their limestone skeletons are cemented together. | NOAA, Flower Garden Banks National Marine Sanctuary |
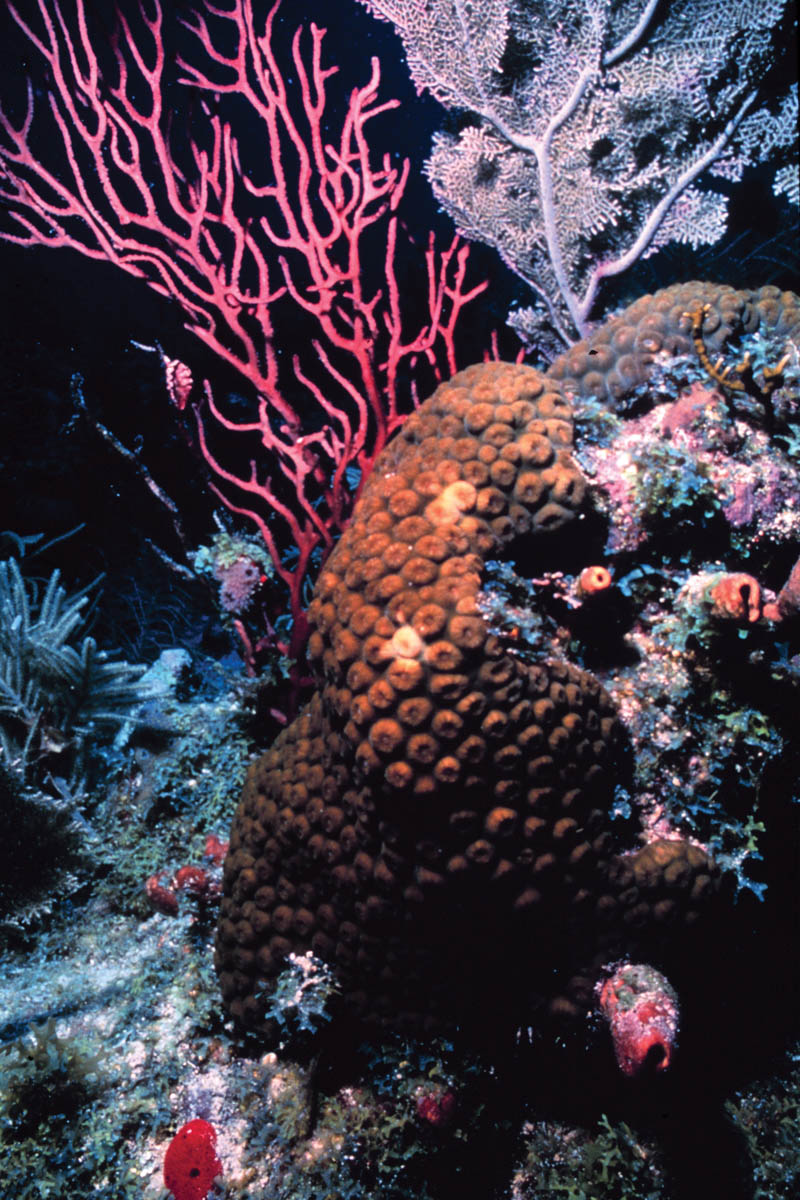
| FIGURE 33.15 | 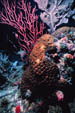 | Healthy coral polyps display vibrant colors. | NOAA, Florida Keys National Marine Sanctuary/Mike White |
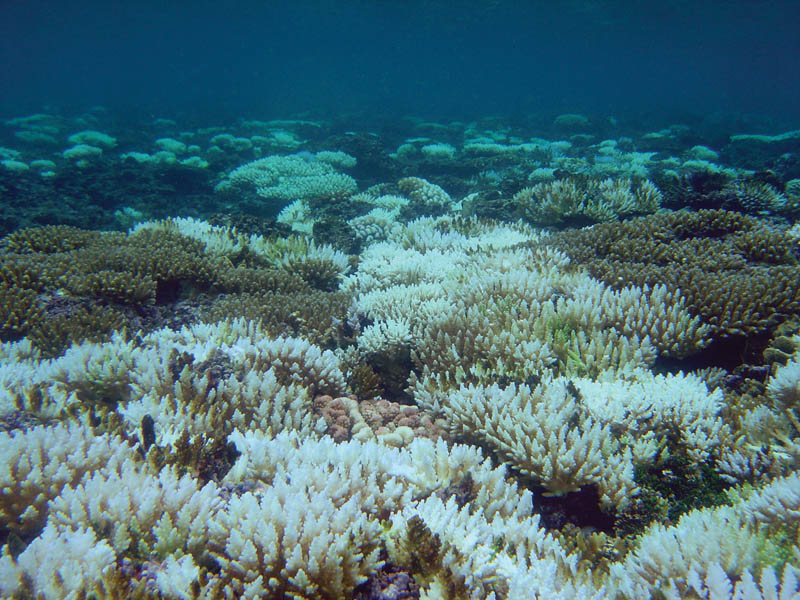
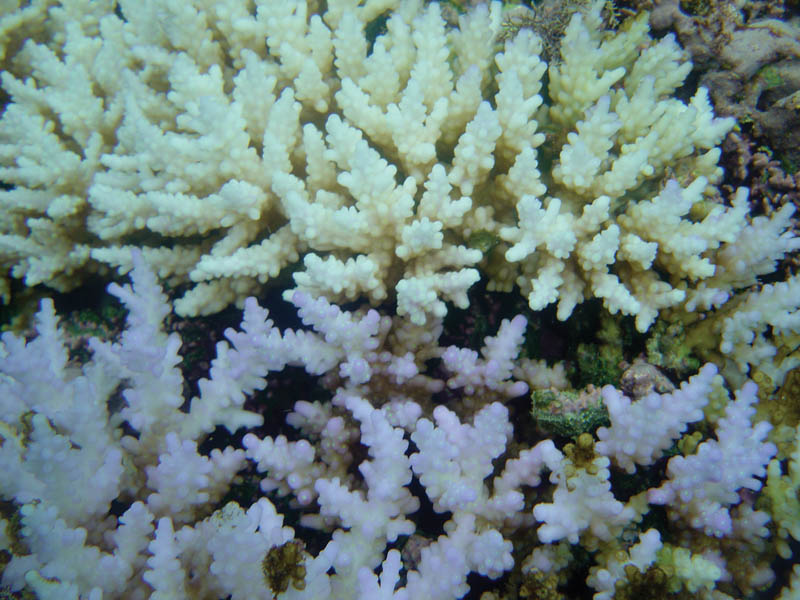
| FIGURE 33.16 |  | Bleaching causes the brilliant colors of the coral reef to fade to white. | NOAA/David Burdick |
| FIGURE 33.17 |  | When water temperatures become too hot or too cold, corals will bleach. Most will eventually die. | NOAA |
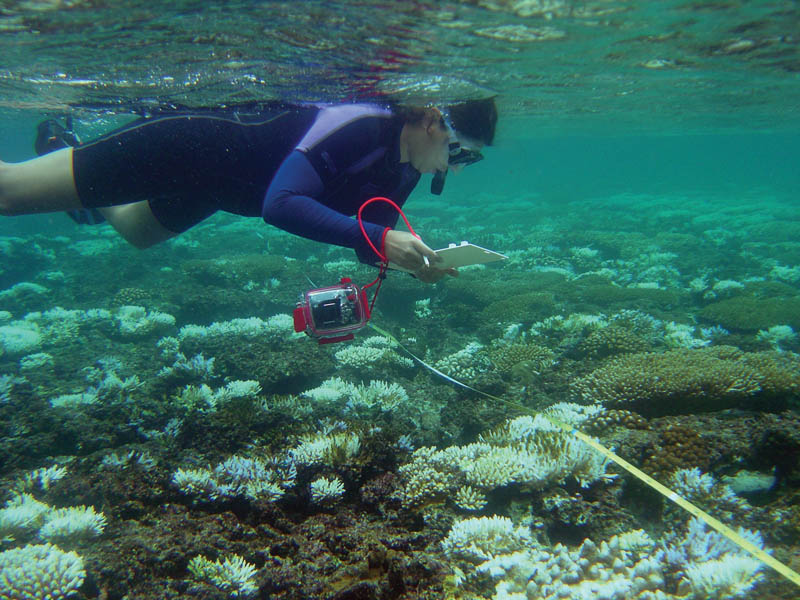
| FIGURE 33.18 |  | Scientist studying an area affected by coral reef bleaching. Data collected in the water are analyzed along with those collected from satellites, buoys, and other sources. | NOAA/David Burdick |
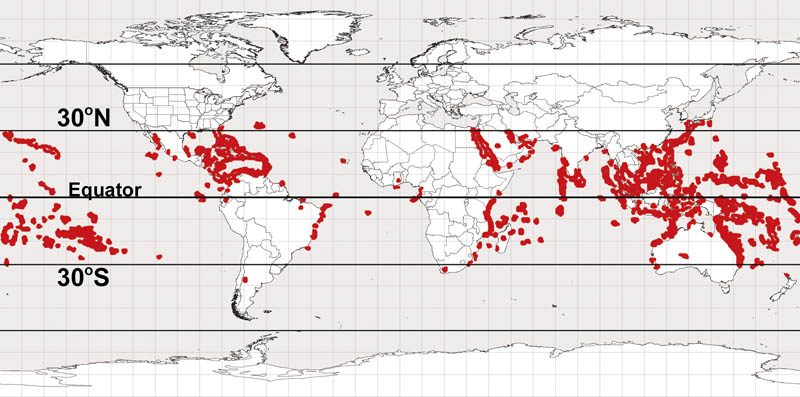
| FIGURE 33.19 |  | Coral reefs are normally located between 30° N and 30° S latitude. | Adapted from NOAA National Ocean Service |
| FIGURE 33.20 |  | Tourism contributes to the economic importance of coral reefs. Have you or anyone you know ever visited a coral reef to go snorkeling, scuba diving, or to enjoy other activities? | OAR, National Undersea Research Program |
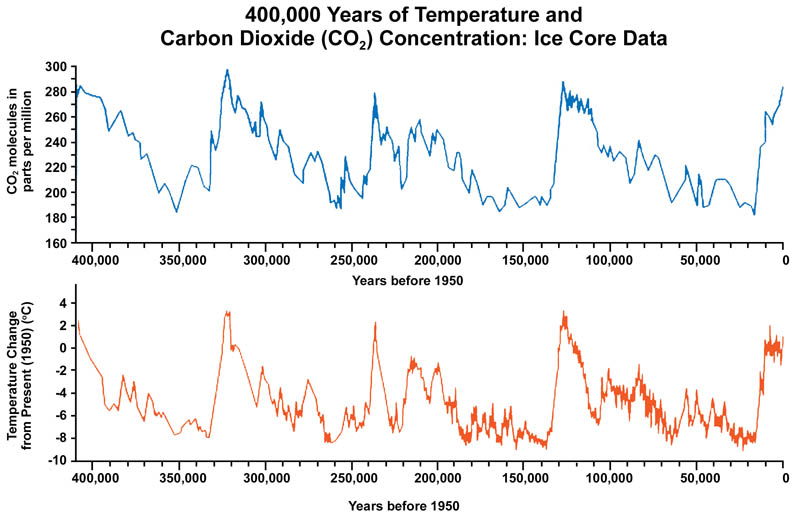
| FIGURE 33.22 |  | There have been many changes of climate in Earth's history. Major changes can happen gradually or over several decades. | Source Petit et. al, 1999 |
| FIGURE 33.23 | 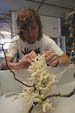 | A scientist studies a coral sample in a shipboard laboratory. Research can lead to reducing adverse impacts of human activities. | NOAA Office of Ocean Exploration and Research/Art Howard |
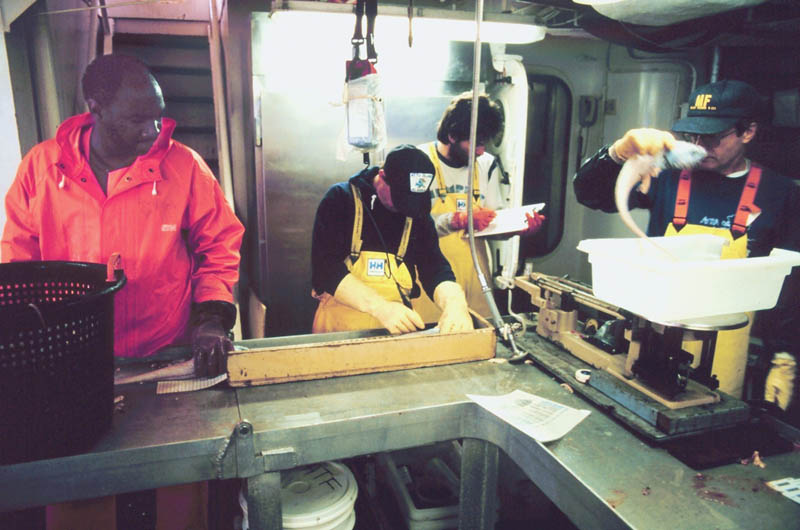
| FIGURE 33.24 |  | Scientists make observations of fish. All species are susceptible to changes in climate. | NOAA, NMFS/Allen M. Shimada |
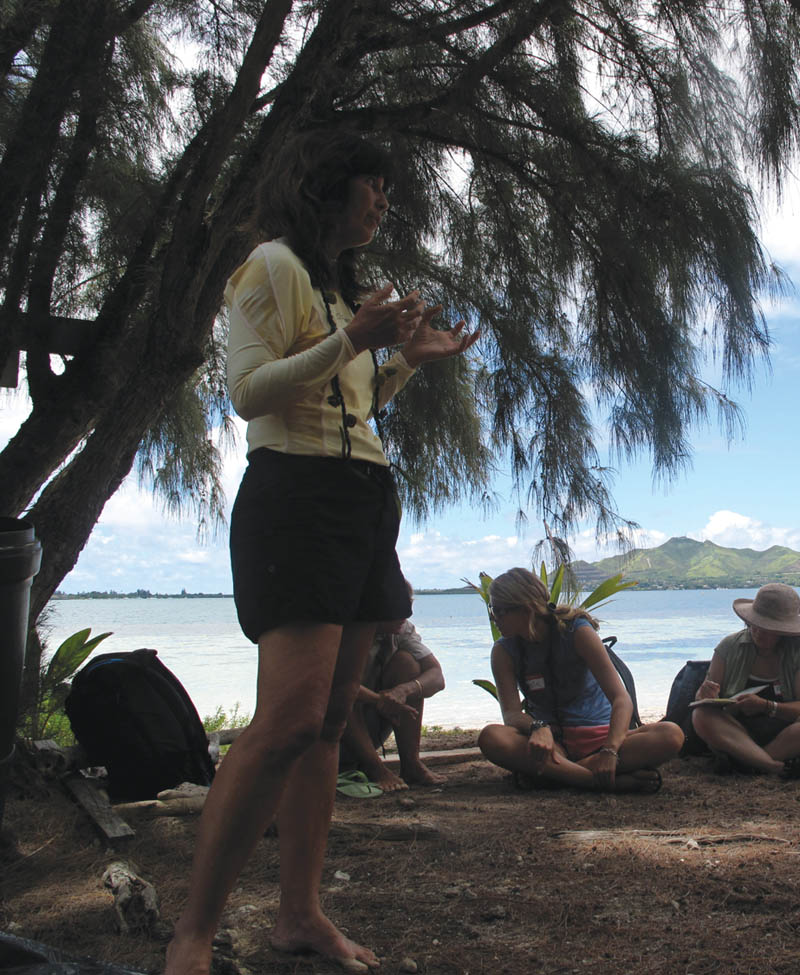
| FIGURE 33.25 |  | Dr. Ku'ulei Rodgers discusses coral bleaching and acidification with educators at the Hawaii Institute of Marine Biology. | Meghan Marrero |
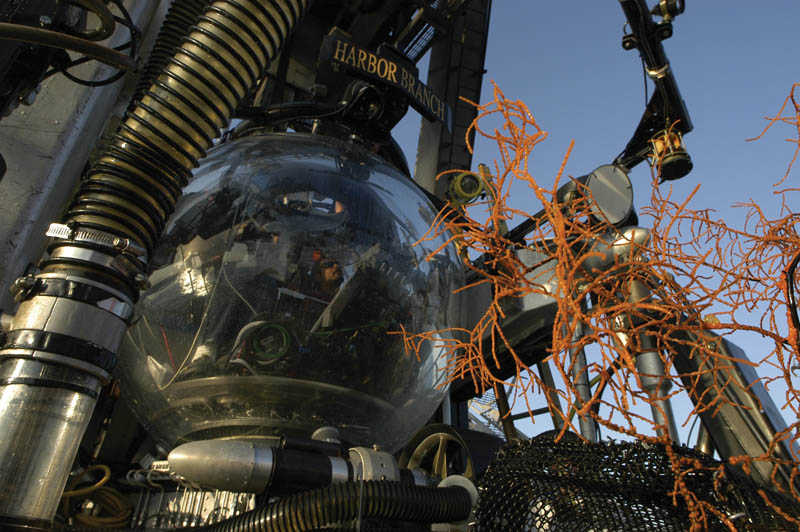
| FIGURE 33.26 |  | Scientists in a submersible prepare to venture underwater. Deep sea corals' growth can indicate climate change over many years. | NOAA, NOAA Office of Ocean Exploration and Research/Art Howard |
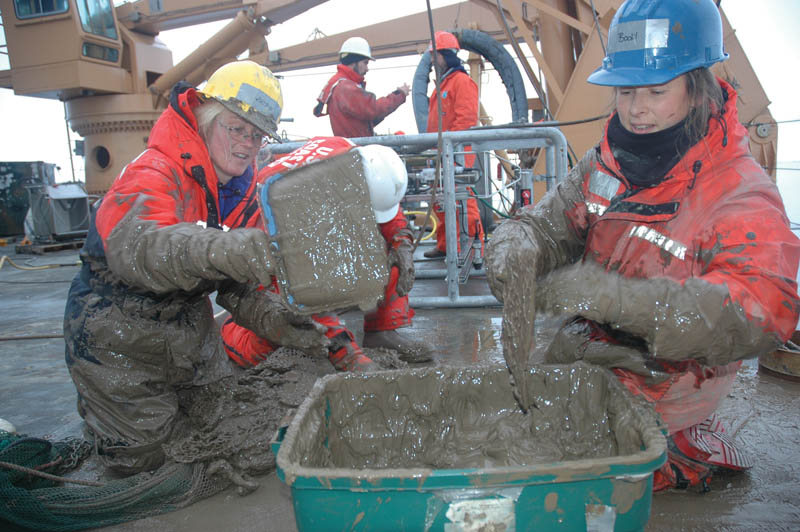
| FIGURE 33.27 |  | Scientists collect seafloor sediments. The ocean floor holds evidence of change over time. | NOAA Office of Ocean Exploration and Research/Jeremy Potter |
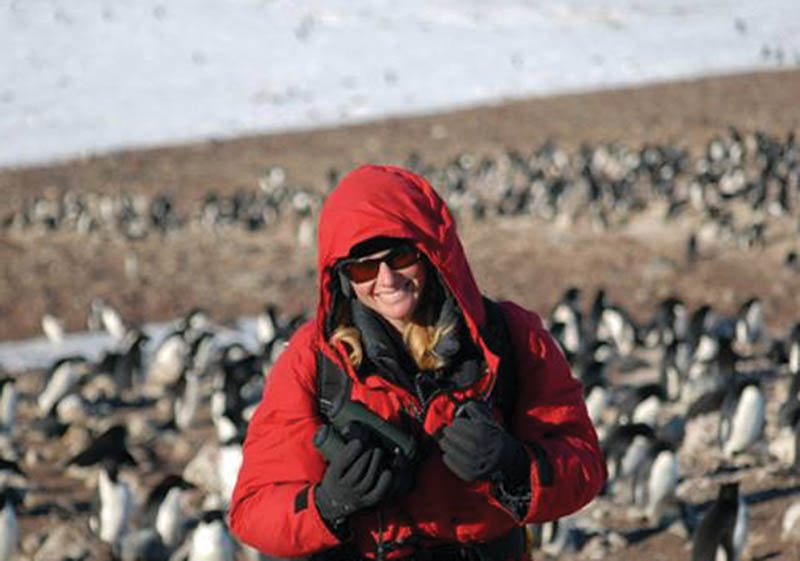
| FIGURE 33.28 |  | Marine Science: The Dynamic Ocean scientist Michelle Hester studies penguins in Antarctica. | PenguinScience.org |
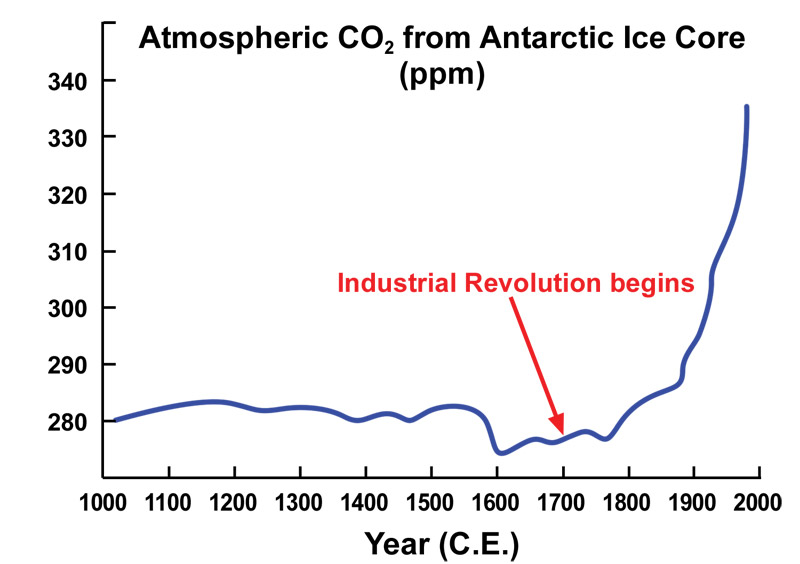
| FIGURE 33.29 |  | The amount of greenhouse gas CO2 appears stable since before 1000 C.E. until the Industrial Revolution. | NOAA, NCDC, CSIRO |
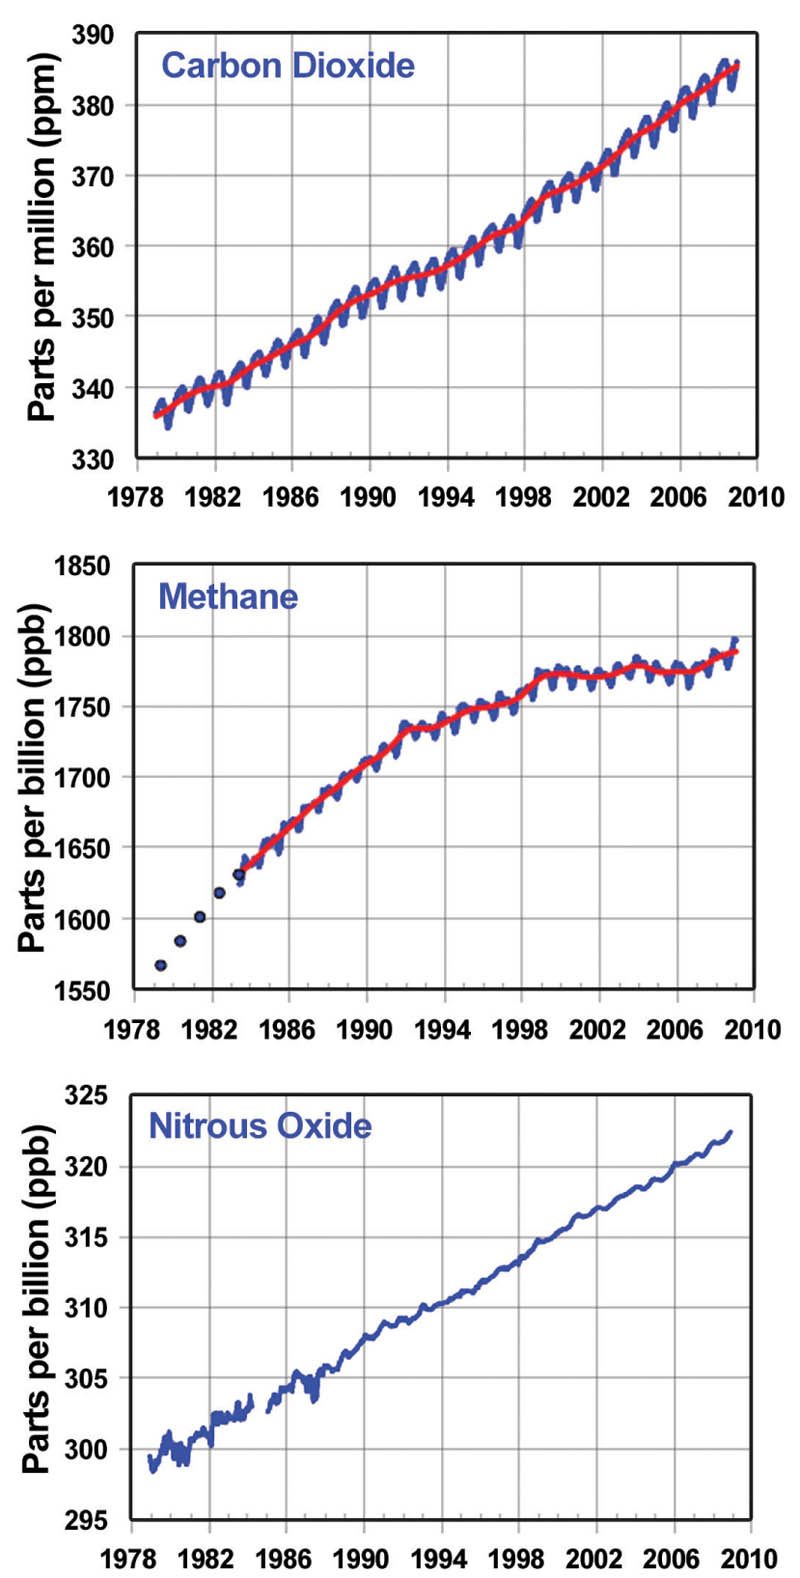
| FIGURE 33.30 | 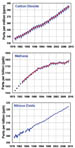 | Average global concentrations of carbon dioxide (CO2), methane (CH4), and nitrous oxide (N2O) molecules in the air as measured since the late 1970s from the NOAA global flask sampling network of 38 stations around the globe. | NOAA Earth System Research Laboratory |
| FIGURE 33.32 |  | Holiday light bulbs are the example used to equate CO2 concentrations with an amount of energy per square meter on Earth. Increasing CO2 in the atmosphere suggests more heat energy per Earth's surface area. | photos.com |
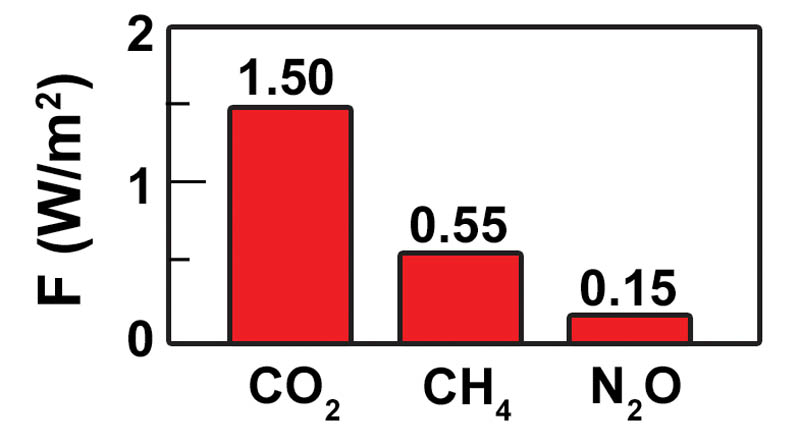
| FIGURE 33.33 |  | The bar graph illustrates the relative radiative forcings of the greenhouse gases since 1750. | NASA, GISS |
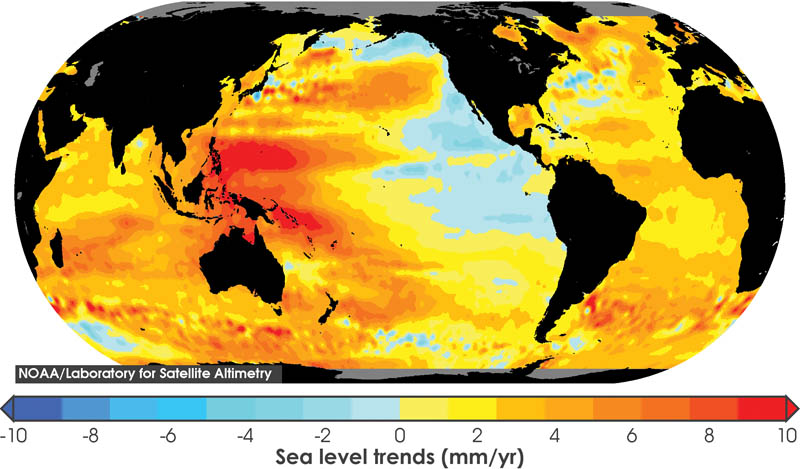
| FIGURE 33.34 |  | The image shows the average increase in sea level across the globe since 1992. The TOPEX, Jason-1, and Jason-2 satellites have provided this data since 1992. | NOAA, Satellite Oceanography and Climatology Division, Laboratory for Satellite Altimetry |
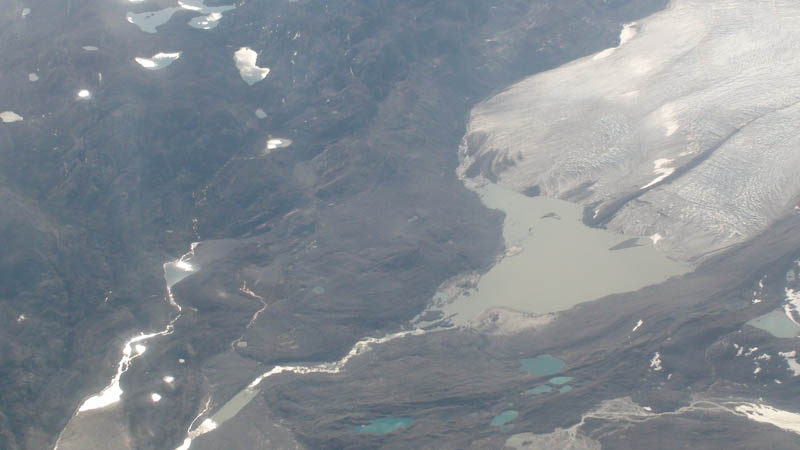
| FIGURE 33.35 |  | Greenland glaciers melt and flow into the ocean, to an extent, during summer. Scientists are poised to monitor this activity in the coming years. | Glen Schuster |
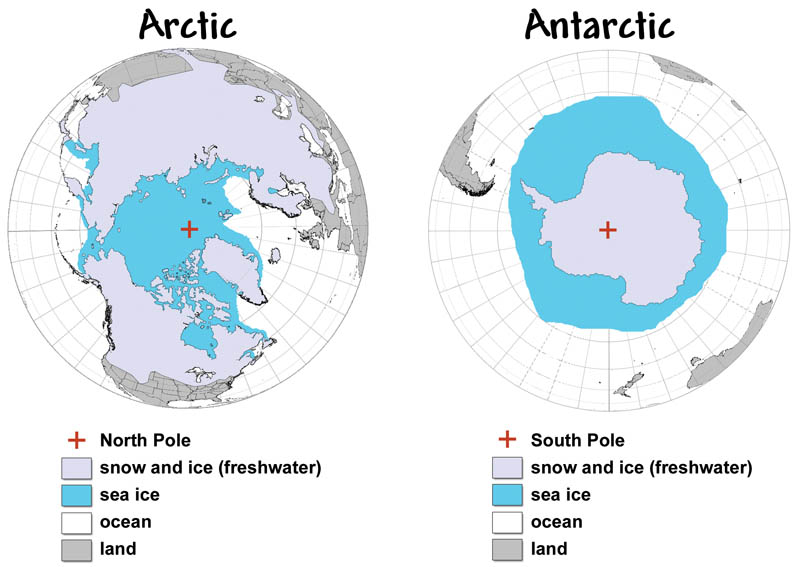
| FIGURE 33.36 |  | Maps showing freshwater snow and ice and sea ice in the Arctic and Antarctic. | U.S. Satellite Laboratory |
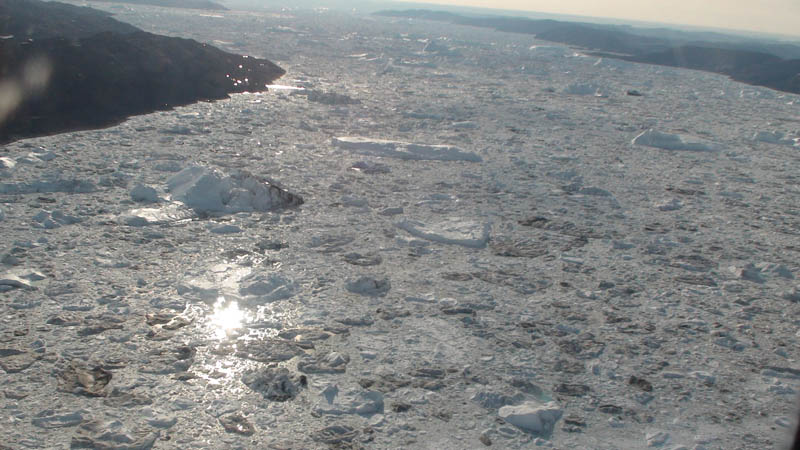
| FIGURE 33.37 |  | Freshwater icebergs break off from glacial ice and eventually melt in the ocean. | Glen Schuster |
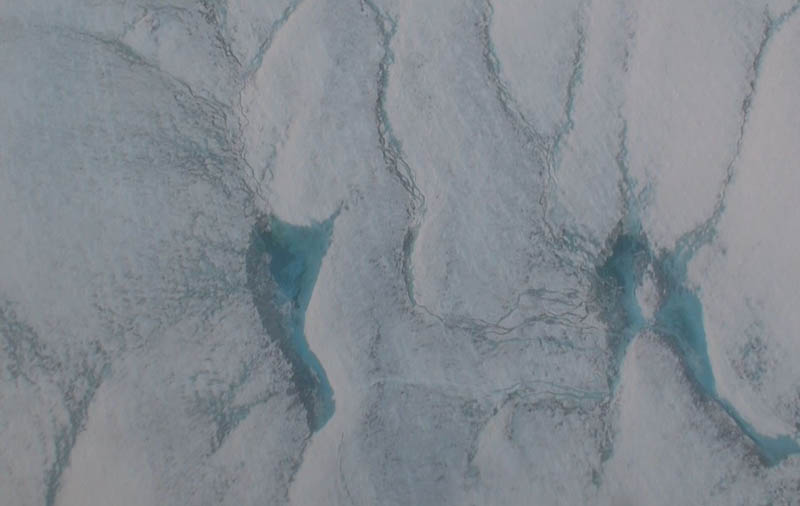
| FIGURE 33.38 |  | Close look at meltwater pools. Greenland glaciers in summer pool water that runs along the frozen surface over great distances. | Glen Schuster |
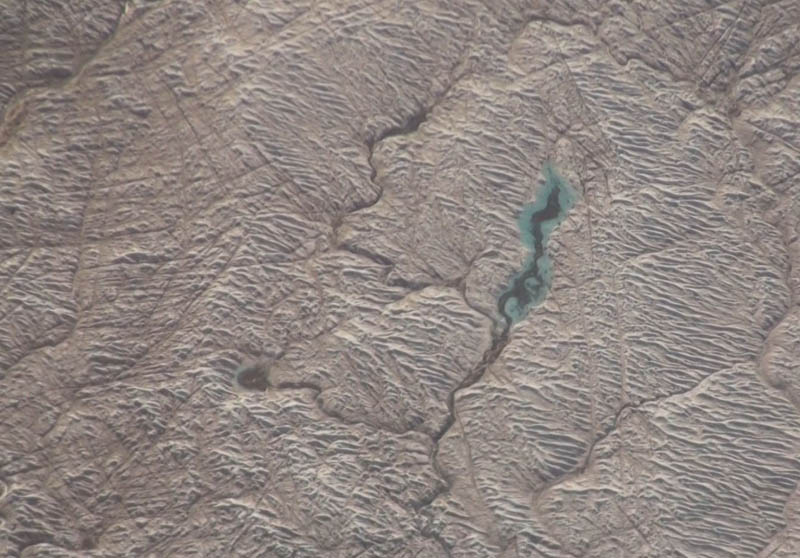
| FIGURE 33.39 |  | Wider view of meltwater pools accumulating during summer in Greenland, and the system of water flow they create. | Glen Schuster |
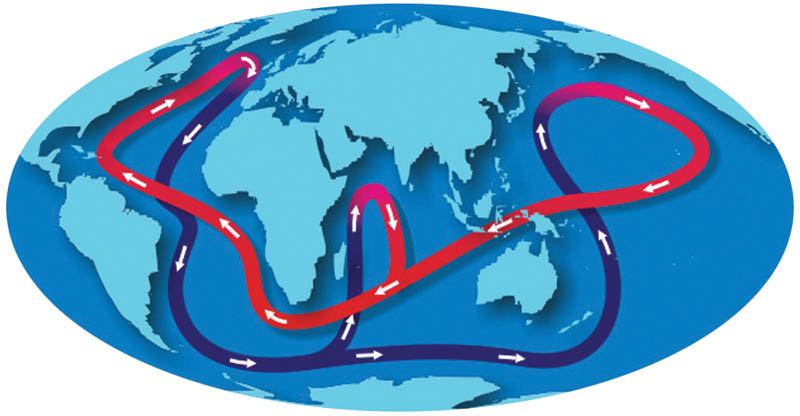
| FIGURE 33.40 |  | The Global Conveyor Belt carries heat to Earth's Polar Regions. Scientists are concerned that as ocean temperatures increase, the water may not become cool enough to sink in the North Atlantic, altering the entire worldwide circulation of water and heat. | NOAA, NWS |
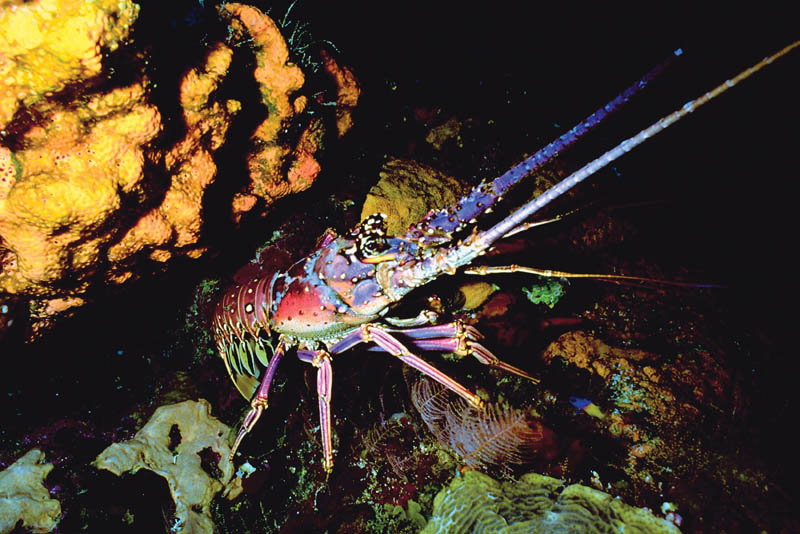
| FIGURE 33.41 |  | Spiny Lobster peeks out of its hiding place in the coral. Many marine invertebrates rely on carbonate ions (CO3 -) in the ocean to build their shells. | photos.com |
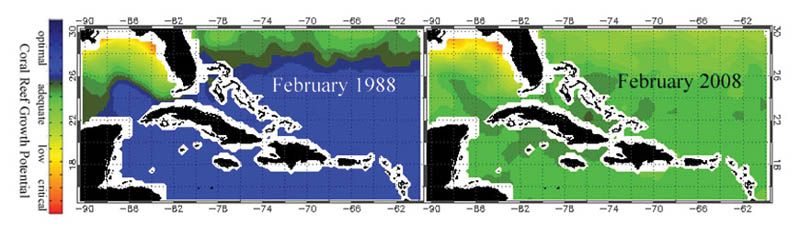
| FIGURE 33.42 |  | The growth potential in recent years for coral reefs near Florida and in the Caribbean has been dramatically reduced. | NOAA |
| FIGURE 33.44 |  | Climate scientists actively assimilate Earth data from satellites and ground-based measurements in order to derive climate models, in an effort to better understand our changing climate. | photos.com, NOAA, Geophysical Fluid Dynamics Laboratory (GFDL) |
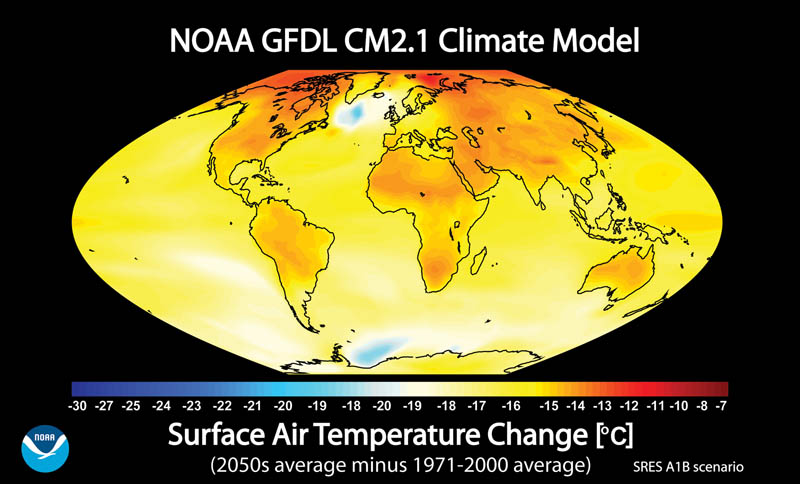
| FIGURE 33.45 |  | Climate models compute complicated algorithms and generate forecasts. Potential increases in temperature could be extreme in the coming fifty years or more. | NASA, GSFC |
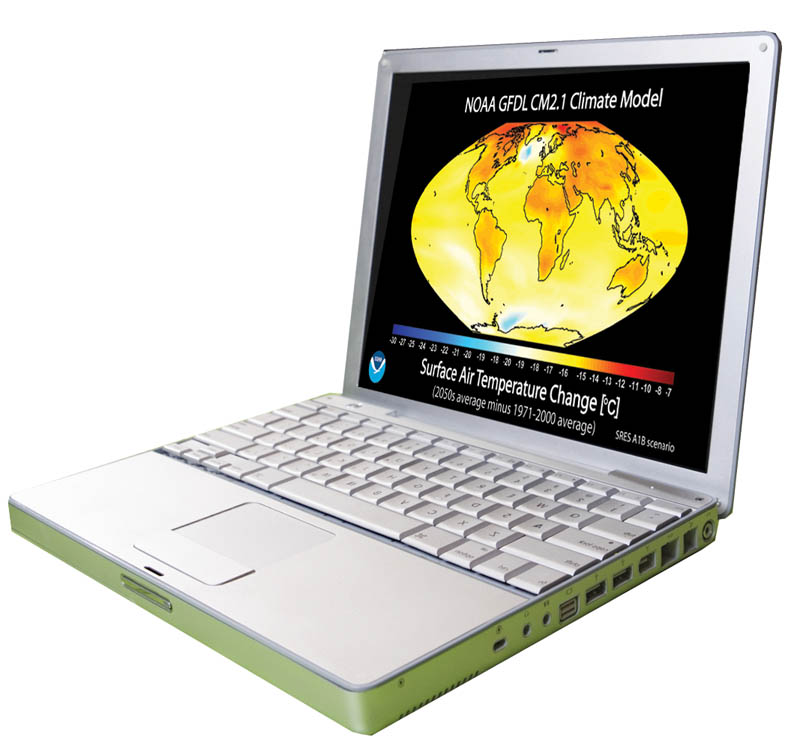
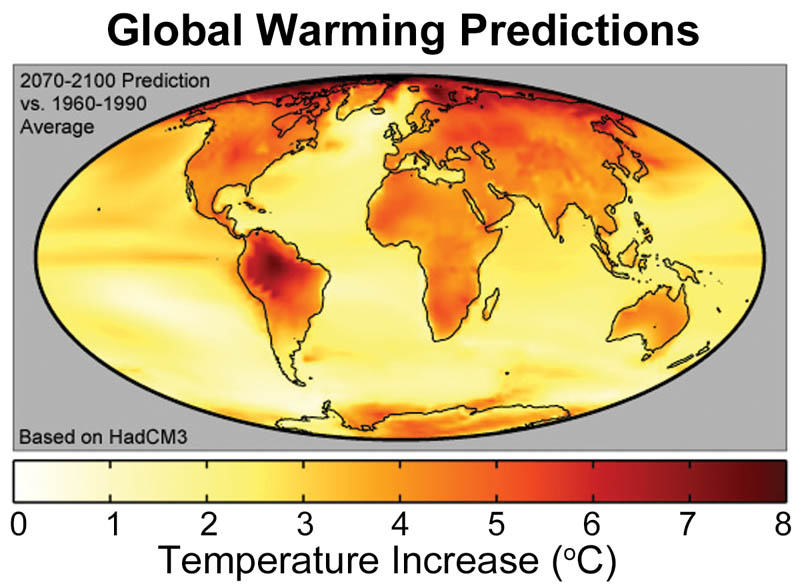
| FIGURE 33.46 |  | Computer models, using information from today, show examples of forecasted temperature increases in the future. | NOAA, Geophysical Fluid Dynamics Laboratory (GFDL) |
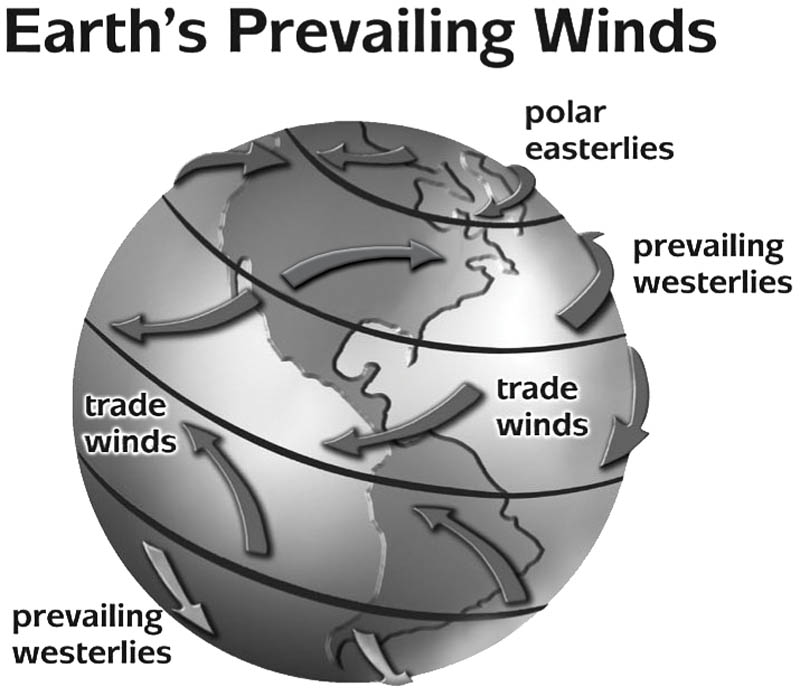
| FIGURE 33.48 |  | Earth's prevailing winds. Illustration shows common surface winds just above Earth's surface. | U.S. Satellite Laboratory |
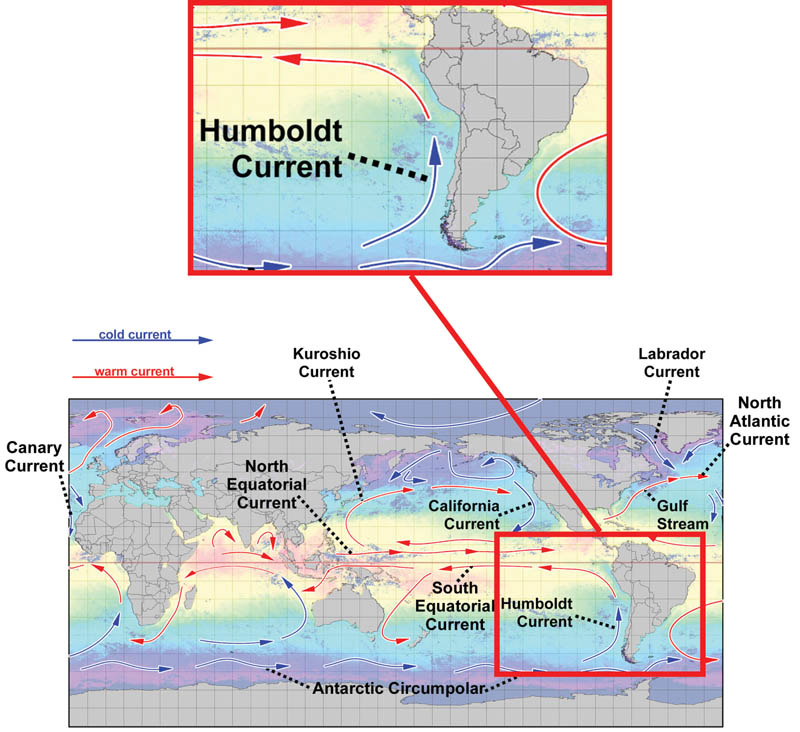
| FIGURE 33.49 |  | Maps showing the Humboldt Current as well as select warm and cold currents. Notice the relationships with Earth's prevailing surface winds from FIGURE 33.48. | U.S. Satellite Laboratory |
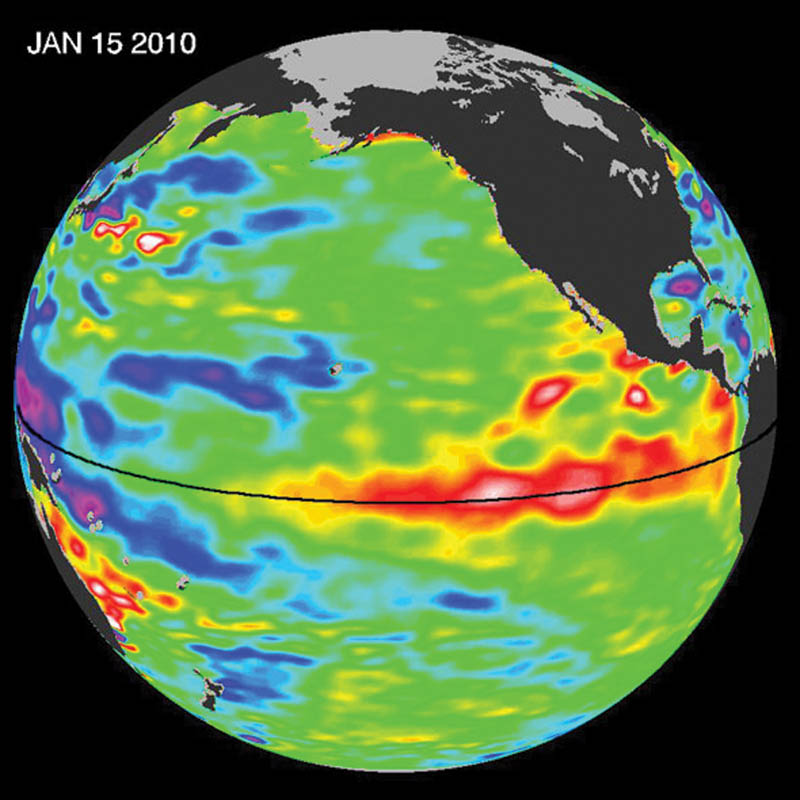
| FIGURE 33.50 |  | El Niño as observed in January 2010. Warmest surface sea waters are visible over the Eastern Equatorial Pacific Ocean. This anomaly is the signature for the phenomenon. | NASA |
| FIGURE 33.51 |  | La Niña as observed in April 2008. Waters are colder than normal along the Equator in the Pacific. This occurrence is the signature for this phenomenon, influencing short term climate. | NASA's Earth Observatory |
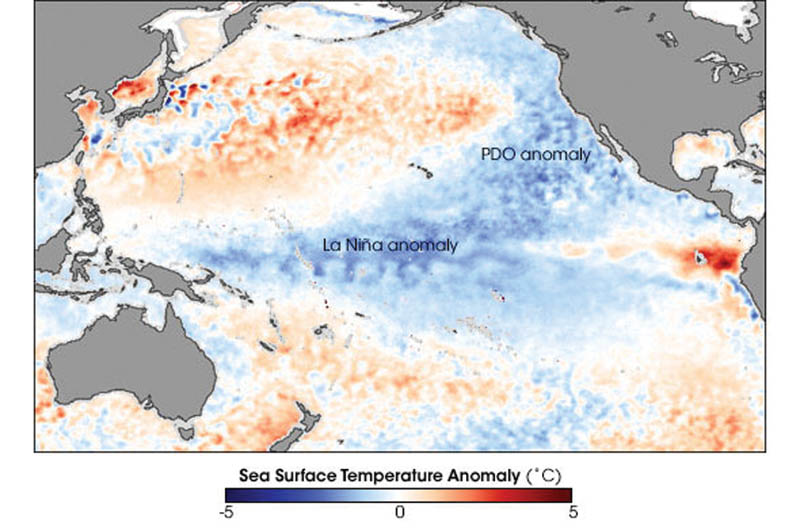
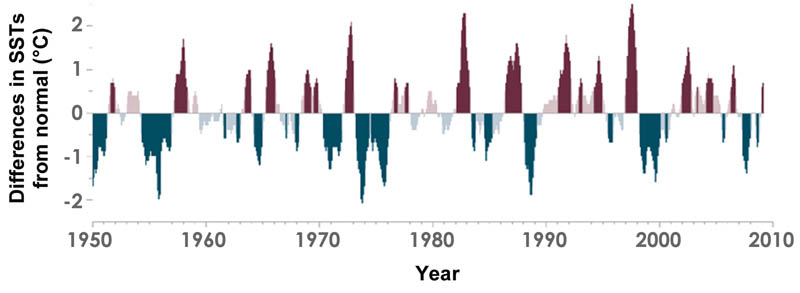
| FIGURE 33.52 |  | SST difference map shows cooler temperatures during a 2008 La Niña event. Cycles of El Niño and La Niña are apparent in the graph. When the y-axis index is > 0.5, an El Niño event was observed. When the y-axis index was < 0.5, a La Niña event occurred. | NOAA Climate Services |
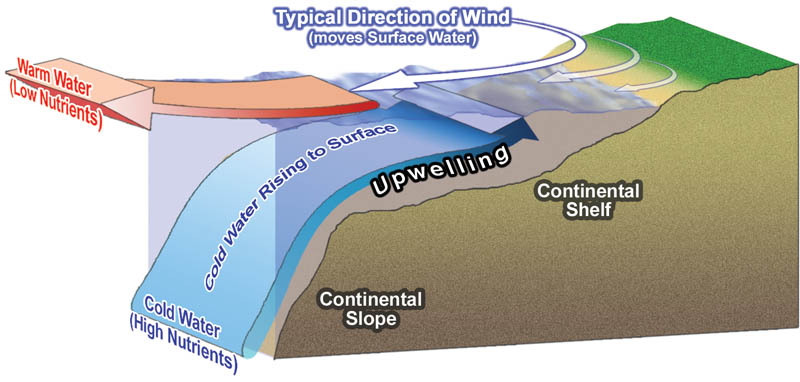
| FIGURE 33.53 |  | Upwelling diagram illustrates a scenario when cooler surface waters are exposed. Winds moving water offshore set the stage for this typical environmental condition. In the process, high-nutrient waters rise to the top of the water column. | U.S. Satellite Laboratory |
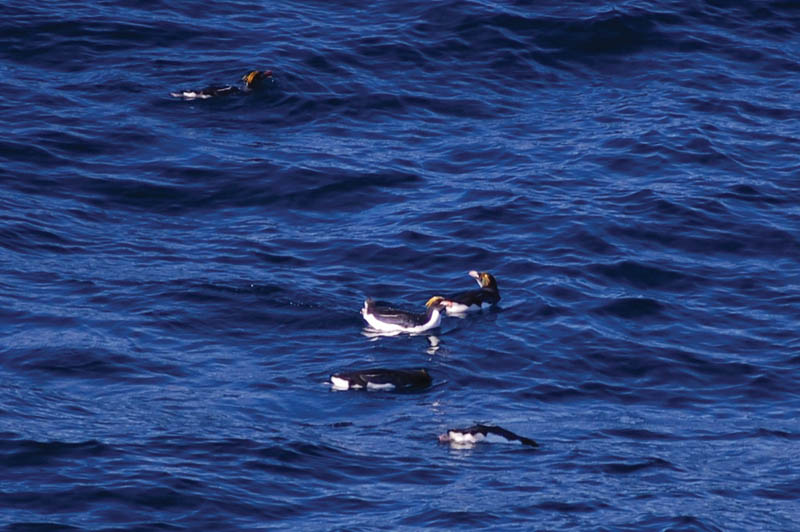
| FIGURE 33.54 |  | Penguins, such as these Macaroni Penguins, and other seabirds are common along the Chilean coasts, where there is tremendous upwelling. | NOAA Corps/Lieutenant Elizabeth Crapo |
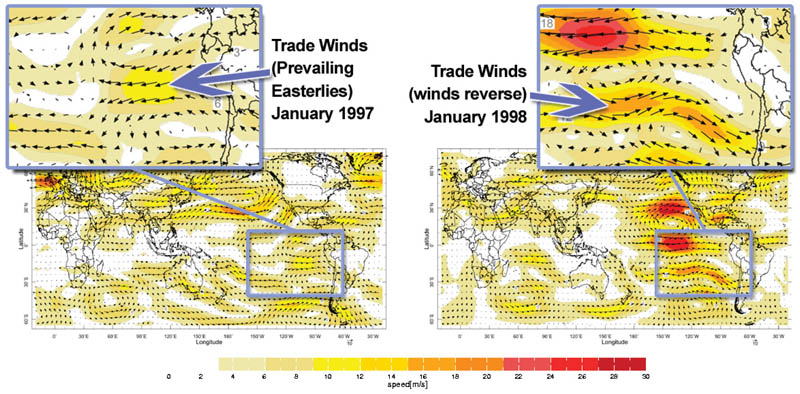
| FIGURE 33.55 |  | Surface wind data for January 1997 and January 1998 show varied conditions in the trade winds. When winds blow from west to east, they affect surface sea heights, and drive a potential El Niño event. | NOAA |
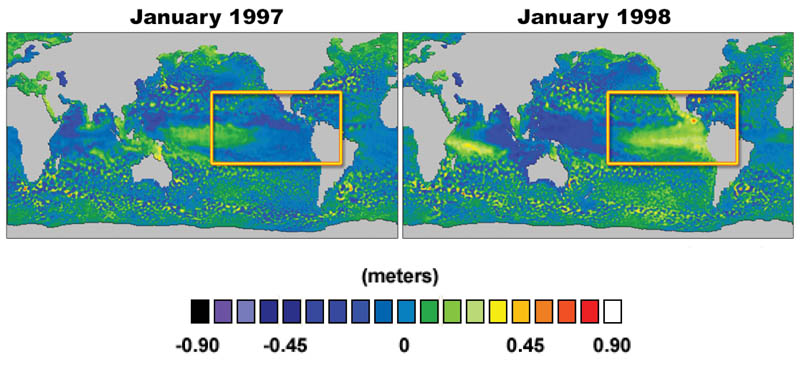
| FIGURE 33.56 |  | Sea height anomaly data show higher-than-normal sea heights off of the West Coast of South America in January 1998. This anomaly is characteristic of an El Niño event, which triggers changes in weather patterns around the globe. | NOAA |
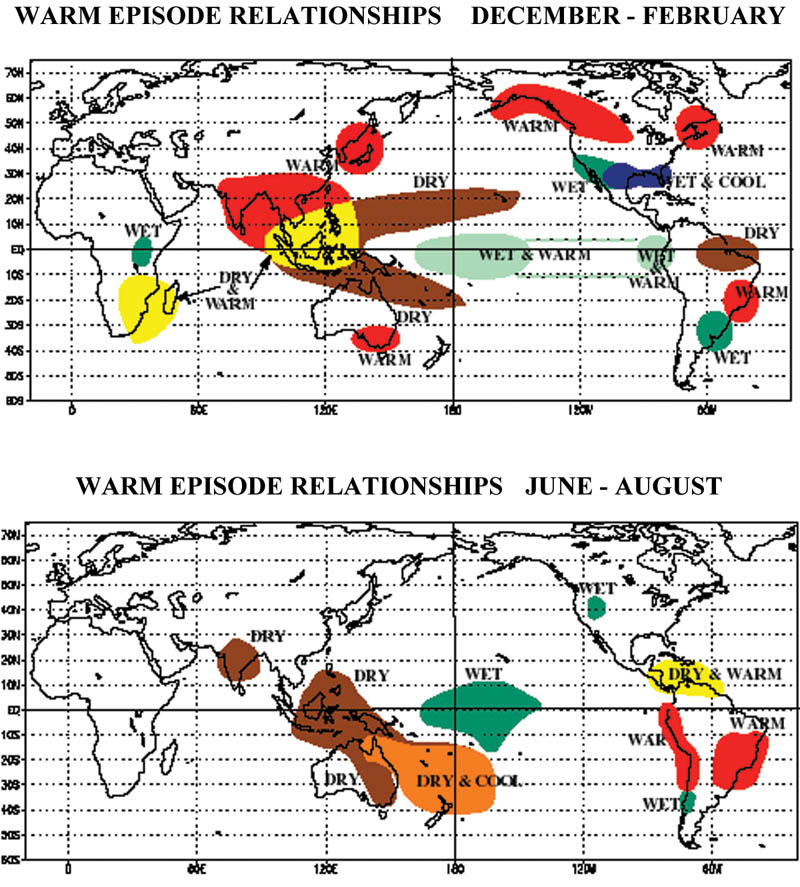
| FIGURE 33.57 |  | The effects of an El Niño event are felt around the world, for up to 18 months. | NOAA, National Weather Service (NWS) |
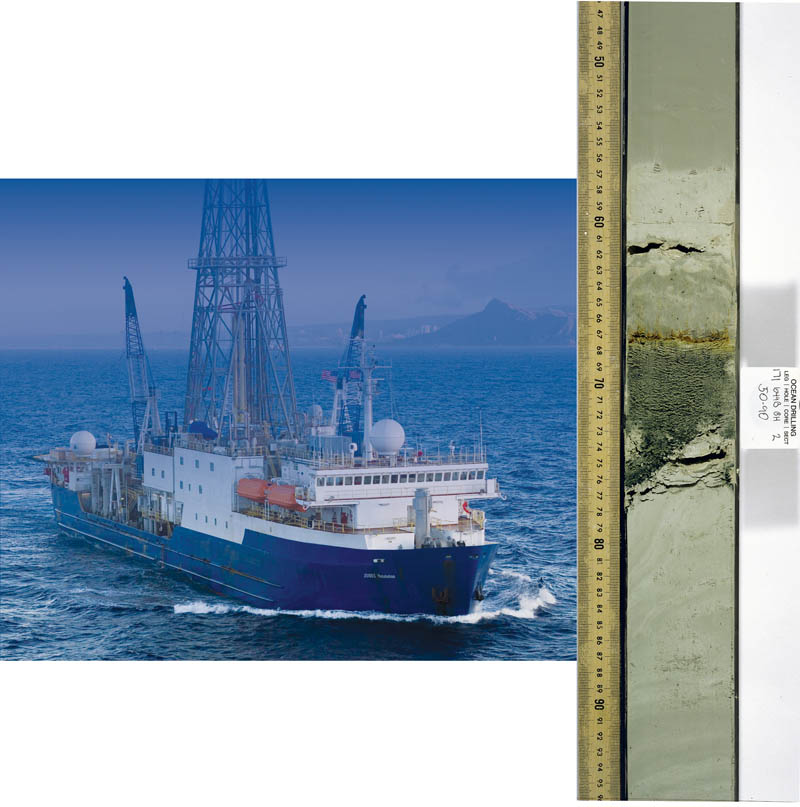
| FIGURE 33.58 |  | This core sample from the bottom of the ocean provides remarkable evidence of an asteroid impact on the Yucatán Peninsula 65 million years ago, when dinosaurs went extinct. In geologic time, this was the Cretaceous-Tertiary Boundary. The JOIDES Resolution obtained the core 480 kilometers (~298 miles) east of Florida, over 1,920 kilometers (~1,193 miles) from the now-buried impact crater. The core was drilled 2,658 meters (~8,720 feet) below the ocean surface, and 128 meters (~420 feet) below the ocean floor. The layers include fossils, and are punctuated by dust and ash fallout, as well as material blasted from the crater. | Integrated Ocean Drilling Program, Deep Earth Academy |
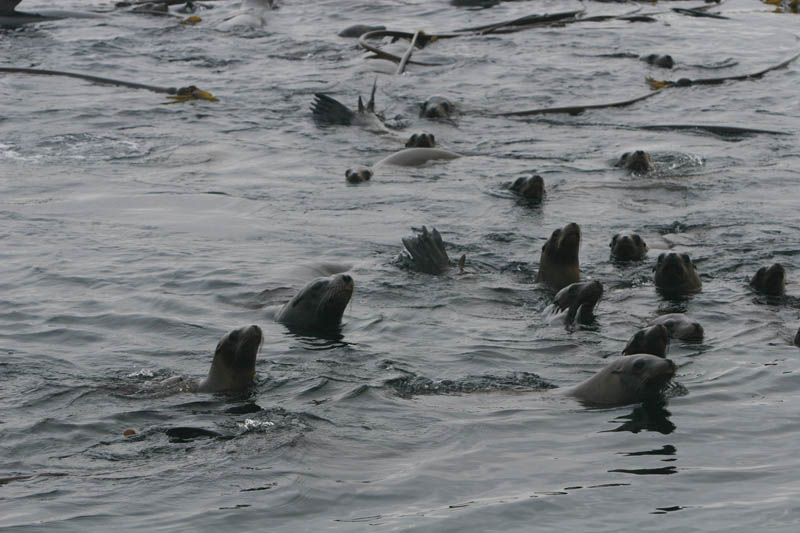
| FIGURE 33.59 |  | California Sea Lions swimming on the surface in the Cordell Bank National Marine Sanctuary. | NOAA/Jennifer Stock |